Multiple Choice
Identify the choice that best
completes the statement or answers the question.
|
|
|
1.
|
Determine the number of turning points on this polynomial function: 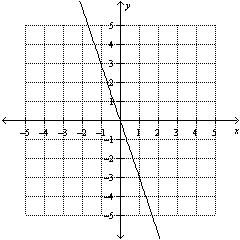
|
|
|
2.
|
Determine the number of turning points on this polynomial function: 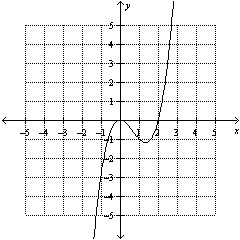
|
|
|
3.
|
Determine the degree of this polynomial function: f( x) =  +
2 x
|
|
|
4.
|
Fill in the blanks to describe the end behaviour of this polynomial
function: The curve extends from quadrant ____ to quadrant ____. 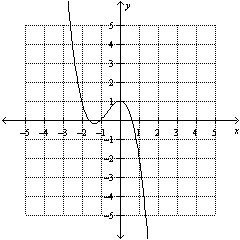 A. | II; I | B. | II; IV | C. | III;
I | D. | III; IV |
|
|
|
5.
|
Use a ruler to help you estimate the slope for a line that best approximates the
data in the scatter plot. 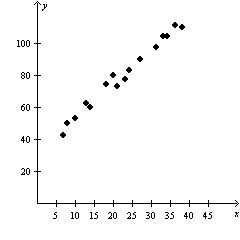
|
|
|
6.
|
Determine the y-intercept of the exponential function j(x)
= a(b)x, if a > 0, b > 0.
|
|
|
7.
|
A scatter plot is drawn using a data set. 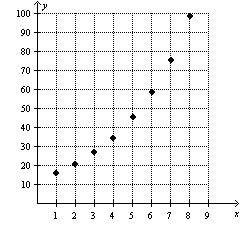
Identify the
equation of the curve of best fit. A. | y = 12(1.3)x | B. | y =
12(0.3)x | C. | y =
4(1.5)x | D. | y =
4(0.5)x |
|
|
|
8.
|
Which function will have the fastest decrease in the y-values?
A. | y = – log x log x | B. | y = –2 log
x | C. | y = –log x | D. | y = –5 log
x |
|
|
|
9.
|
The equation of the logarithmic function that models a data set is y =
8.2 + 0.7 ln x.
Extrapolate the value of y when x = 22.
A. | y = 10.4 | B. | y = 10.8 | C. | y =
11.1 | D. | y = 11.3 |
|
|
|
10.
|
A scatter plot is drawn using a data set. Identify the equation of the curve of
best fit. 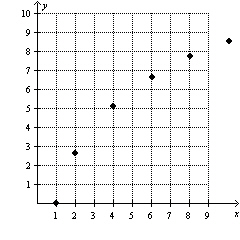
A. | y = 8.5 + log x | B. | y = 8.5 + ln
x | C. | y = 8.5 log x | D. | y = 8.5 ln
x |
|
|
|
11.
|
Choose the best estimate for the central angle in degrees. 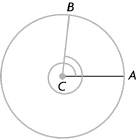
|
|
|
12.
|
Determine the period of the following graph. 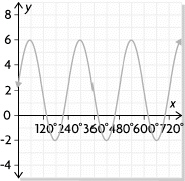
|
|
|
13.
|
A sinusoidal graph has an amplitude of 10 and a maximum at the point (18, 5).
Determine the midline of the graph.
A. | y = 0 | B. | y = –5 | C. | y =
13 | D. | y = 8 |
|
|
|
14.
|
A sinusoidal graph has a maximum at the point (5, 12) and a minimum at the point
(12, 5). Determine the midline of the graph.
A. | y = 0 | B. | y = 5 | C. | y =
12 | D. | y = 8.5 |
|
|
|
15.
|
Determine the period of the following function. y = cos  x x + 12 A. | 180° | B. | 360° | C. | 720° | D. | 1080° |
|
Short Answer
|
|
|
1.
|
The tide depth in a Pacific harbour from noon on March 1, 2012 to noon the next
day can be modelled by the cubic function
f(t) = 0.001t3 –
0.061t2 + 0.870t + 0.315
where f is the tide depth in metres and
t is the number of hours after noon.
Determine the tide depth at 10:00 on the second
day.
|
|
|
2.
|
Create a scatter plot of the following data. Does the data appear to be
logarithmic? Explain how you know. x | 1 | 2 | 4 | 6 | 8 | 10 | y | 9.0 | 6.6 | 4.2 | 2.8 | 1.8 | 1.0 | | | | | | | |
|
|
|
3.
|
Determine the period of the following graph. 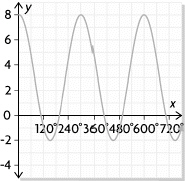
|
Problem
|
|
|
1.
|
A soccer coach want to know the relationship between the number of shots his
team takes during a game and the number of goals they score. He collected the following data from the
last few games. Shots | 18 | 14 | 8 | 21 | 15 | 10 | 25 | 18 | Goals | 2 | 1 | 0 | 3 | 2 | 0 | 4 | 3 | | | | | | | | | |
a) Create a scatter plot, and draw a
line of best fit for the data. b) Use your graph to estimate the number of shots required
to score 2 goals.
|
|
|
2.
|
The graph of a sinusoidal function is shown. Describe this graph by determining
its range, the equation of its midline, and its amplitude. Show your work. 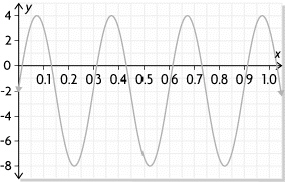
|
|
|
3.
|
Describe the graph of the following function by stating the amplitude, equation
of its midline, range, and period. Show your work.
y = 6 cos 8(x – 1.4)
– 4
|