Multiple Choice
Identify the choice that best
completes the statement or answers the question.
|
|
|
1.
|
Determine the degree of this polynomial function: 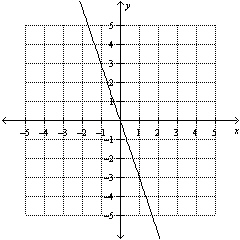
|
|
|
2.
|
The growth of a tree can be modelled by the function
h(t) =
2.3t + 0.45
where h represents the height in metres and t represents the time
in years.
Approximately how tall will the tree be in 8 years?
A. | 18.85 m | B. | 17.15 m | C. | 19.55
m | D. | 16.75 m |
|
|
|
3.
|
Use a ruler to help you estimate the slope for a line that best approximates the
data in the scatter plot. 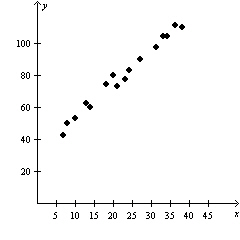
|
|
|
4.
|
Use a ruler to help you estimate the slope for a line that best approximates the
data in the scatter plot. 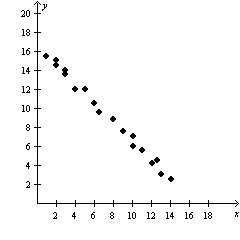
|
|
|
5.
|
Determine the equation of the linear regression function for the data. x | 1 | 2 | 3 | 4 | 5 | 6 | y | 84 | 155 | 241 | 310 | 405 | 478 | | | | | | | |
A. | y = 79.7x – 0.07 | B. | y = 78.1x –
1.07 | C. | y = 79.7x + 0.07 | D. | y = 78.1x +
1.07 |
|
|
|
6.
|
Match the following graph with its function. 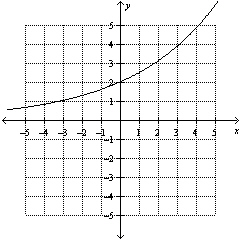 A. | y = 3(0.5)x | B. | y =
2(1.25)x | C. | y =
0.5(3)x | D. | y =
2(0.75)x |
|
|
|
7.
|
The following data set involves exponential growth. Determine the missing value
from the table. x | 0 | 1 | 2 | 3 | 4 | 5 | 6 | 7 | y | 3 | 6 | 12 | 24 | 48 | | 192 | 384 | | | | | | | | | |
|
|
|
8.
|
The following data set involves exponential decay. Determine the missing value
from the table. x | 1 | 2 | 3 | 4 | 5 | 6 | 7 | y | 6144 | 1536 | 384 | 96 | | 6 | 1.5 | | | | | | | | |
|
|
|
9.
|
Determine the equation of the exponential regression function for the data.
x | 3 | 4 | 5 | 6 | 8 | 10 | y | 1.85 | 2.07 | 2.32 | 2.62 | 3.25 | 4.10 | | | | | | | |
A. | y = 1.85(1.24)x | B. | y =
1.85(1.12)x | C. | y =
1.32(1.24)x | D. | y =
1.32(1.12)x |
|
|
|
10.
|
The equation of the exponential function that models a data set is
y =
78.20(0.87)x
Determine the domain of this function.
A. | {x | x > 0, x Î
R} | B. | {x | x Î R} | C. | {x | x
> 78.20, x Î R} | D. | {x | x
> 0.87, x Î R} |
|
|
|
11.
|
Choose the best estimate for 0.1 radians in degrees.
|
|
|
12.
|
Choose the best estimate for 0.8 radians in degrees.
|
|
|
13.
|
A sinusoidal graph has a maximum at the point (4, –8) and the next minimum
is at the point (7, –10). Determine the period of the graph.
|
|
|
14.
|
Determine the amplitude of the following function.
y = 0.5 sin
(x – 2)
|
|
|
15.
|
Determine the midline of the following function.
y = 3 sin 2(x
+ 90°) – 1
A. | y = 2 | B. | y = 3 | C. | y =
0 | D. | y = –1 |
|
Short Answer
|
|
|
1.
|
The volume of water in a cylindrical water tank being drained can be modelled by
the function
v(t) = –3.8t + 225
where v represents the volume
in litres and t represents the time in minutes.
How long will it take for the volume to get
to 0 L? Round your answer to the nearest minute.
|
|
|
2.
|
Determine the equation of the quadratic regression function for the data. Round
all values to the nearest hundredth. x | 1.5 | 2 | 2.5 | 3 | 3.5 | 4 | 4.5 | 5 | y | –6.8 | –6.4 | –6.6 | –7.3 | –8.5 | –10.2 | –12.8 | –16.0 | | | | | | | | | |
|
|
|
3.
|
Determine whether the following data set involves exponential growth,
exponential decay, or neither. Explain how you know. x | 0 | 1 | 2 | 4 | 6 | 8 | 10 | 12 | y | 1.8 | 1.5 | 1.3 | 1.5 | 1.6 | 1.8 | 2.5 | 4.2 | | | | | | | | | |
|
Problem
|
|
|
1.
|
A research lab recorded the radioactive decay of a 38 mg sample of thorium-243.
The data table shows the amount of thorium-243 remaining at the end of each week. Day | 0 | 7 | 14 | 21 | 28 | 35 | Amount of Thorium
(mg) |
38.0
|
31.0
|
25.3
|
20.6
|
16.7
|
13.6
| | | | | | | |
a) Use exponential
regression to model the radioactive decay. Round all values to the nearest hundredth. b)
Estimate the amount of thorium-243 remaining after 2 days, to the nearest tenth of a milligram.
Show your work. c) Use your function to model the decay of a 90 mg sample of thorium-243.
Estimate the amount of thorium-243 remaining after the first week, to the nearest tenth of a
milligram. Show your work.
|
|
|
2.
|
Imagine that it is now 4:45 p.m. a) How many degrees will the minute
hand rotate through before midnight? What is the equivalent angle in radians? Show your
work. b) What time will it be when the minute hand has rotated through  radians? Show
your work. c) Determine how many degrees are in this rotation. Show your work.
|
|
|
3.
|
A competitive gymnast’s coach analyzes one particular series of jumps.
These jumps can be modelled by the sinusoidal function h( t) = 11.5 sin  +
9.8 where h( t) represents the height of the gymnast in feet and t
represents the time in seconds. a) What is the maximum height of the gymnast jumps?
Explain how you know. b) How often does the gymnast jump? Explain how you know.
|