Multiple Choice
Identify the choice that best
completes the statement or answers the question.
|
|
|
1.
|
Choose the best estimate for 55° in radians.
|
|
|
2.
|
Choose the best estimate for 136° in radians.
|
|
|
3.
|
Choose the best estimate for 7 radians in degrees.
|
|
|
4.
|
Choose the best estimate for the central angle in radians. 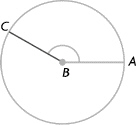
|
|
|
5.
|
Imagine that it is now 2 p.m. What time will it be when the minute hand has
rotated through 300°?
|
|
|
6.
|
Determine the period of the following graph. 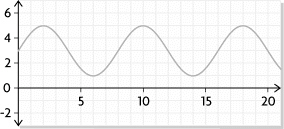
|
|
|
7.
|
Determine the range of the following graph.  A. | {y | 1 £ y £ 5, y Î R} | B. | {y | –2
£ y £ 2, y Î R} | C. | {y | 0 £
y £ 4, y Î
R} | D. | {y | y Î
R} |
|
|
|
8.
|
Determine the amplitude of the following function.
y = 0.5 sin
(x – 2)
|
|
|
9.
|
Determine the equation of the sinusoidal regression function for the
data. x | 0 | 1 | 2 | 3 | 4 | 5 | 6 | 7 | y | –1.0 | 1.1 | 11.1 | 16.5 | 10.5 | 0.6 | –0.8 | 8.0 | | | | | | | | | |
A. | y = 7.4 sin (1.2x – 2.0) + 9.1 | B. | y = 7.4 sin
(1.2x – 2.0) – 9.1 | C. | y = 9.1 sin (1.2x – 2.0) +
7.4 | D. | y = 9.1 sin (1.2x – 2.0) –
7.4 |
|
|
|
10.
|
The amount of daylight in a town can be modelled by the sinusoidal function
d(t) = 4.37 cos 0.017t + 12.52
where d(t) represents the
hours of daylight and t represents the number of days since June 20, 2012.
How many hours
of daylight should be expected on June 20, 2013?
A. | 16.80 h | B. | 16.84 h | C. | 16.88
h | D. | 16.92 h |
|
Short Answer
|
|
|
1.
|
Determine the midline of the following graph. 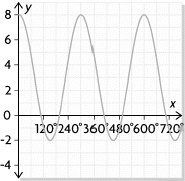
|
|
|
2.
|
The following data set is sinusoidal. Determine the missing value from the
table. x | –13 | –12 | –11 | –10 | –9 | –8 | –7 | y | 17 | 20 | 17 | | 3 | 0 | 3 | | | | | | | | |
|
|
|
3.
|
Use sinusoidal regression to determine the missing value, to the nearest
tenth. x | 1 | 2 | 3 | 4 | 5 | 6 | 7 | 8 | y | 12.4 | 11.0 | 5.6 | | 11.7 | 12.0 | 6.5 | 5.6 | | | | | | | | | |
|
Problem
|
|
|
1.
|
For the following pair of angle measures, determine which measure is greater.
Explain your reasoning.
800°, 4.5p
|
|
|
2.
|
Meena is sitting in an inner tube in the wave pool at West Edmonton Mall. The
following table gives the depth of the water below her. Time
(s) | 0 | 1 | 2 | 3 | 4 | 5 | 6 | 7 | Depth (m) | 3.1 | 3.8 | 4.0 | 3.5 | 2.6 | 2.1 | 1.9 | 2.4 | | | | | | | | | |
a) Create a scatter plot, and draw a curve of best fit for
the data using sinusoidal regression. b) Determine the depth of the water after 9 s, to the
nearest tenth of a metre. Show your work.
|