Multiple Choice
Identify the choice that best
completes the statement or answers the question.
|
|
|
1.
|
Choose the best estimate for 3.1 radians in degrees.
|
|
|
2.
|
Choose the best estimate for the central angle in degrees. 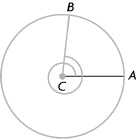
|
|
|
3.
|
Choose the best estimate for the central angle in radians. 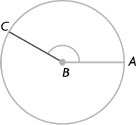
|
|
|
4.
|
Imagine that it is now 2 p.m. What time will it be when the minute hand has
rotated through  radians?
|
|
|
5.
|
Determine the period of the following graph. 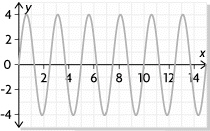
|
|
|
6.
|
The following data set is sinusoidal. Determine the missing value from the
table. x | 0 | 1 | 2 | 3 | 4 | 5 | 6 | y | 1.0 | 2.5 | 4.0 | 2.5 | 1.0 | 2.5 | | | | | | | | | |
|
|
|
7.
|
Determine the equation of the sinusoidal regression function for the
data. x | –5 | –4 | –3 | –2 | –1 | 0 | 1 | 2 | y | 0.8 | 1.5 | 1.8 | 1.4 | 0.8 | 0.0 | –0.2 | 0.1 | | | | | | | | | |
A. | y = 1.0 sin 0.8(x – 2.3) + 0.8 | B. | y = 1.0 sin
0.8(x + 2.3) + 1.0 | C. | y = 0.8 sin 1.0(x – 3.2) +
1.0 | D. | y = 0.8 sin 1.0(x + 3.2) + 0.8 |
|
|
|
8.
|
The amount of daylight in a town can be modelled by the sinusoidal function
d(t) = 4.37 cos 0.017t + 12.52
where d(t) represents the
hours of daylight and t represents the number of days since June 20, 2012.
How many hours
of daylight should be expected on August 20, 2012?
A. | 14.74 h | B. | 14.89 h | C. | 15.04
h | D. | 15.19 h |
|
|
|
9.
|
The amount of daylight in a town can be modelled by the sinusoidal function
d(t) = 4.37 cos 0.017t + 12.52
where d(t) represents the
hours of daylight and t represents the number of days since June 20, 2012.
How many hours
of daylight should be expected on June 20, 2013?
A. | 16.80 h | B. | 16.84 h | C. | 16.88
h | D. | 16.92 h |
|
|
|
10.
|
The height of a mass attached to a spring can be modelled by the sinusoidal
function
h(t) = 84 – 6.7 cos 24.8t
where h(t)
represents the height in centimetres and t represents the time in seconds.
What is the
height of the mass after 10 s?
A. | 77.4 cm | B. | 84.0 cm | C. | 86.9
cm | D. | 90.6 cm |
|
Short Answer
|
|
|
1.
|
How many turning points does the graph of y = cos x have from
–1.5p to 1.5p?
|
|
|
2.
|
Determine the period of the following graph. 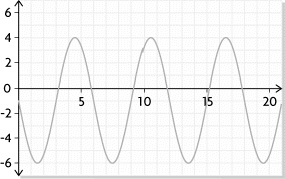
|
|
|
3.
|
Determine the range of the following function.
y = 10 cos 4(x
– 180°) + 2
|
Problem
|
|
|
1.
|
The graph of a sinusoidal function is shown. a) Determine the period
of this graph. Show your work. b) Determine the y-value of this graph when x
= 3. Explain your answer. c) Determine the y-value of this graph when x =
1.75. Explain your answer. 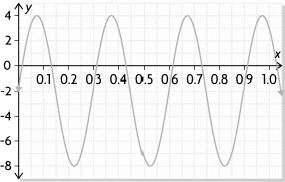
|
|
|
2.
|
The height of a point on a bicycle wheel is described by the
function
h(t) = 34 cos 4.6(t + 1.7) + 34
where h(t)
represents the height of the point in centimetres and t represents the time in
seconds.
a) What is the diameter of the bicycle wheel? Show your work.
b) How
fast is the bicycle moving, to the nearest metre per second? Show your work.
|