Multiple Choice
Identify the choice that best
completes the statement or answers the question.
|
|
|
1.
|
Choose the best estimate for 55° in radians.
|
|
|
2.
|
Choose the best estimate for 0.8 radians in degrees.
|
|
|
3.
|
Choose the best estimate for 3.1 radians in degrees.
|
|
|
4.
|
Choose the best estimate for the central angle in radians. 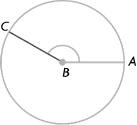
|
|
|
5.
|
Determine the amplitude of the following graph. 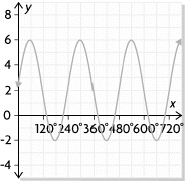
|
|
|
6.
|
Determine the period of the following graph. 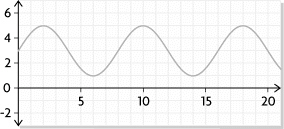
|
|
|
7.
|
A sinusoidal graph has a maximum at the point (5, 12) and a minimum at the point
(12, 5). Determine the midline of the graph.
A. | y = 0 | B. | y = 5 | C. | y =
12 | D. | y = 8.5 |
|
|
|
8.
|
Determine the midline of the following function. y = cos  x x + 12 A. | y = 12 | B. | y = 3 | C. | y =
4 | D. | y = 0 |
|
|
|
9.
|
Determine the range of the following function. y = cos  x x +
12 A. | {y | 11 £ y £ 13, y Î R} | B. | {y | –4
£ y £ 4, y Î R} | C. | {y | 9 £
y £ 15, y Î
R} | D. | {y | y Î
R} |
|
|
|
10.
|
The following data set is sinusoidal. Determine the missing value from the
table. x | 0 | 2 | 4 | 6 | 8 | 10 | 18 | y | 5.8 | 6.8 | 5.8 | 4.8 | 5.8 | 6.8 | | | | | | | | | |
|
Short Answer
|
|
|
1.
|
Estimate, to the nearest degree, the measure of the central angle. Check your
estimate with a protractor. 
|
|
|
2.
|
Determine the midline of the following graph. 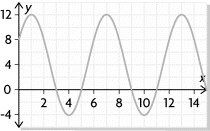
|
|
|
3.
|
Determine the horizontal and vertical translations applied to y = sin
x to obtain the following function.
y = sin (x + 60°) – 5
|
Problem
|
|
|
1.
|
The graph of a sinusoidal function is shown. Describe this graph by determining
its range, the equation of its midline, its amplitude, and its period. Show your work. 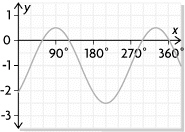
|
|
|
2.
|
Kira is sitting in an inner tube in the wave pool. The depth of the water below
her, in terms of time, during a series of waves can be represented by the graph shown. a)
What is the depth of the water below Kira when no waves are being generated? Explain how you
know. b) How high is each wave? Show your work. 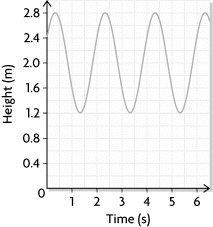
|