Multiple Choice
Identify the choice that best
completes the statement or answers the question.
|
|
|
1.
|
Which of the following is an exponential function?
A. | f(x) = p(1)x | B. | g(x) =
3(–7)x | C. | h(x) = 4(p)x | D. | j(x) =
x(2)x |
|
|
|
2.
|
Determine the y-intercept of the exponential function g( x)
=  . A. | 0 | B. |  | C. | 5 | D. | 10 |
|
|
|
3.
|
Which option best describes the behaviour of the exponential function
g( x) =  ? A. | increasing because a > 1 | B. | decreasing because 0 < a <
1 | C. | increasing because b > 1 | D. | decreasing because 0 < b <
1 |
|
|
|
4.
|
Which function will have the fastest decrease in the y-values?
A. | y = – ln x ln x | B. | y = –2 ln
x | C. | y = –ln x | D. | y = –1.5 ln
x |
|
|
|
5.
|
Match the following graph with its function. 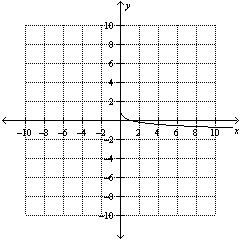
A. | y = – ln x ln x | B. | y = 3 log x | C. | y =
– (3)x (3)x | D. | y =
0.3(10)x |
|
|
|
6.
|
Which exponential equation correctly represents the logarithmic equation
y = ln 20?
A. | 20y = e | B. | ey = 20 | C. | y20 = e | D. | ye =
20 |
|
|
|
7.
|
Which logarithmic equation correctly represents the exponential equation
107 = x?
A. | x = log 7 | B. | x = log 10 | C. | 7 = log
x | D. | 10 = log x |
|
|
|
8.
|
The equation of the logarithmic function that models a data set is y =
8.2 + 0.7 ln x.
Extrapolate the value of y when x = 22.
A. | y = 10.4 | B. | y = 10.8 | C. | y =
11.1 | D. | y = 11.3 |
|
|
|
9.
|
The equation of the logarithmic function that models a data set is y =
43.9 – 8.7 ln x.
Interpolate the value of y when x = 5.5.
A. | y = 23 | B. | y = 25 | C. | y =
27 | D. | y = 29 |
|
|
|
10.
|
The equation of the logarithmic function that models a data set is y =
43.9 – 8.7 ln x.
Determine the range of this function.
A. | {y | y Î R} | B. | {y | y
> 0, y Î R} | C. | {y | y < 43.9, y Î R} | D. | {y | y > –8.7, y
Î R} |
|
Short Answer
|
|
|
1.
|
Use exponential regression to interpolate the value of y when x =
–2. Round your answer to the nearest tenth. x | –6 | –4 | –3 | –1 | 1 | 2 | y | 4.3 | 11.8 | 19.0 | 48.6 | 123.8 | 198.5 | | | | | | | |
|
|
|
2.
|
Determine the equation of the logarithmic regression function for the data.
Round all values to the nearest hundredth. x | 2 | 4 | 6 | 8 | 10 | 12 | y | 0.8 | 5.6 | 9.4 | 12.6 | 15.0 | 17.3 | | | | | | | |
|
|
|
3.
|
Determine the equation of the logarithmic regression function for the data.
Round all values to the nearest hundredth. x | 16 | 17 | 18 | 19 | 20 | 21 | y | 5.6 | 5.8 | 5.9 | 6.0 | 6.0 | 6.1 | | | | | | | |
|
Problem
|
|
|
1.
|
The population of a town has been growing exponentially. The data table shows
the town population in thousands over a 50 year period. Year | 1960 | 1970 | 1980 | 1990 | 2000 | 2010 | Population
(thousands) |
71.1
|
95.6
|
128.2
|
173.2
|
232.4
|
311.8
| | | | | | | |
a) Use exponential
regression to model the population growth. Round all values to the nearest hundredth. b)
Estimate the population of the town in 1950, to the nearest hundred people. Show your
work. c) Estimate the population of the town in 2030, to the nearest hundred people. Show
your work.
|
|
|
2.
|
The population of frogs in a marsh was recorded for several years. Year | 1 | 2 | 3 | 4 | 6 | 7 | 8 | Number of Frogs | 252 | 272 | 284 | 290 | 304 | 308 | 312 | | | | | | | | |
a) Use logarithmic regression to model the data. Round all
values to the nearest hundredth. b) Estimate the frog population in the 5th year. Show your
work. c) Estimate the frog population in the 12th year. Show your work.
|