Multiple Choice
Identify the choice that best
completes the statement or answers the question.
|
|
|
1.
|
Match the following graph with its function. 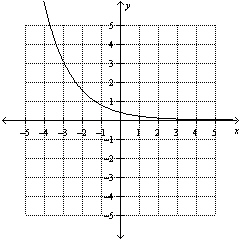
|
|
|
2.
|
The following data set involves exponential growth. Determine the missing value
from the table. x | 0 | 1 | 2 | 3 | 4 | 5 | 6 | y | 0.16 | 0.40 | 1.00 | 2.50 | | 15.63 | 39.06 | | | | | | | | |
|
|
|
3.
|
The following data set involves exponential decay. Determine the missing value
from the table. x | –3 | –2 | –1 | 0 | 1 | 2 | y | 500.00 | 100.00 | | 4.00 | 0.80 | 0.16 | | | | | | | |
A. | 16.00 | B. | 20.00 | C. | 24.00 | D. | 40.00 |
|
|
|
4.
|
Determine the equation of the exponential regression function for the data.
x | 0 | 1 | 2 | 3 | 4 | 5 | y | 74.8 | 60.2 | 47.8 | 38.3 | 30.8 | 24.4 | | | | | | | |
A. | y = 75(0.8)x | B. | y =
75(1.6)x | C. | y =
60(0.8)x | D. | y =
60(1.6)x |
|
|
|
5.
|
The equation of the exponential function that models a data set is
y =
78.20(0.87)x
Interpolate the value of y when x = 5.5.
A. | 36.35 | B. | 46.49 | C. | 22.50 | D. | 38.98 |
|
|
|
6.
|
The equation of the exponential function that models a data set is
y =
6.8(1.03)x
Determine the range of this function.
A. | {y | y > 0, y Î
R} | B. | {y | y Î R} | C. | {y | y
> 6.8, y Î R} | D. | {y | y
> 1.03, y Î R} |
|
|
|
7.
|
Which logarithmic equation correctly represents the exponential equation
107 = x?
A. | x = log 7 | B. | x = log 10 | C. | 7 = log
x | D. | 10 = log x |
|
|
|
8.
|
The following data set involves logarithmic growth. Determine the missing
value. x | 1 | 2.7 | 7.4 | 20.1 | | 148.4 | y | 0.0 | 1.0 | 2.0 | 3.0 | 4.0 | 5.0 | | | | | | | |
A. | 27.5 | B. | 54.6 | C. | 80.4 | D. | 102.3 |
|
|
|
9.
|
Determine the equation of the logarithmic regression function for the
data. x | 3 | 4 | 5 | 6 | 8 | 10 | y | 2.1 | 4.6 | 6.5 | 8.0 | 10.5 | 12.4 | | | | | | | |
A. | y = –6.27 + 8.54 ln x | B. | y =
–7.26 + 7.54 ln x | C. | y = –6.27 + 7.54 ln
x | D. | y = –7.26 + 8.54 ln x |
|
|
|
10.
|
Determine the equation of the logarithmic regression function for the
data. x | 5 | 10 | 15 | 20 | 25 | 30 | y | 96.0 | 94.2 | 93.2 | 92.5 | 92.0 | 91.5 | | | | | | | |
A. | y = 98 – 2.0 ln x | B. | y = 99 – 2.3 ln
x | C. | y = 100 – 2.5 ln x | D. | y = 101 – 2.8 ln
x |
|
Short Answer
|
|
|
1.
|
Determine if the exponential function h( x) =  is increasing
or decreasing.
|
|
|
2.
|
Determine the equation of the exponential regression function for the data.
Round all values to the nearest hundredth. x | 0 | 1 | 3 | 4 | 6 | 8 | y | 0.1 | 0.4 | 5.8 | 21.6 | 295 | 4052 | | | | | | | |
|
|
|
3.
|
Use the equation of the logarithmic regression function for the data to describe
the location of any intercepts. Round your answers to the nearest tenth. x | 2 | 5 | 20 | 50 | 100 | 1000 | y | –3.5 | –2.8 | –1.7 | –1.0 | –0.5 | 1.3 | | | | | | | |
|
Problem
|
|
|
1.
|
A research lab recorded the radioactive decay of a 85 mg sample of bismuth-210.
The data table shows the amount of bismuth-210 remaining at the end of each week. Day | 0 | 7 | 14 | 21 | 28 | 35 | Amount of Bismuth
(mg) |
85.0
|
32.2
|
12.2
|
4.6
|
1.75
|
0.66
| | | | | | | |
a) Create a
scatter plot, and draw a curve of best fit for the data using exponential regression. b)
Use your graph to estimate the half-life of bismuth-210.
|
|
|
2.
|
A social-networking site tracked the growth of its membership during its first
eighteen months. Number of Months |
3
|
6
|
9
|
12
|
15
|
18
| Number of Users
(thousands) |
2.0
|
5.4
|
7.0
|
8.5
|
9.6
|
10.3
| | | | | | | |
a) Create a
scatter plot, and draw a curve of best fit for the data using logarithmic regression. b)
Use your graph to estimate the number of users after 3 years, to the nearest hundred.
|