Multiple Choice
Identify the choice that best
completes the statement or answers the question.
|
|
|
1.
|
Determine the number of turning points on this polynomial function: 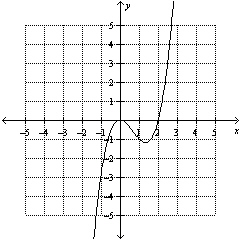
|
|
|
2.
|
Determine the degree of this polynomial function: f( x) =  +
2 x
|
|
|
3.
|
Determine the leading coefficient of this polynomial
function: f( x) =  x3 x3 + 6 x – 8 A. |  | B. | 6 | C. | –8 | D. | 0 |
|
|
|
4.
|
Determine the equation of this polynomial function: 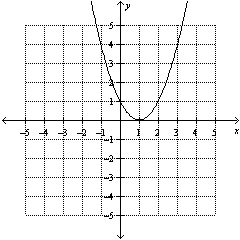 A. | f(x) = –x2 – 3x –
1 | B. | g(x) = x2 – 2x + 1 | C. | h(x) =
–x3 – 2x2 + 1 | D. | j(x) =
x3 + 2x |
|
|
|
5.
|
The growth of a tree can be modelled by the function
h(t) =
2.3t + 0.45
where h represents the height in metres and t represents the time
in years.
Approximately how tall will the tree be in 8 years?
A. | 18.85 m | B. | 17.15 m | C. | 19.55
m | D. | 16.75 m |
|
|
|
6.
|
Use a ruler to help you estimate the y-intercept for a line that best
approximates the data in the scatter plot. 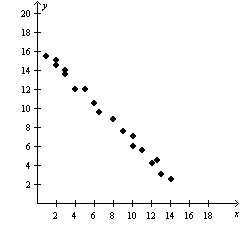
|
|
|
7.
|
Describe the characteristics of the trend in the data. 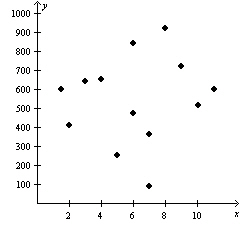 A. | increasing | B. | decreasing | C. | constant | D. | no trend |
|
|
|
8.
|
What kind of relationship might there be between the independent and dependent
variables in this scatter plot? 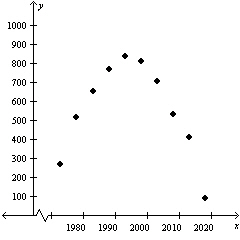 A. | linear | B. | quadratic | C. | cubic
| D. | none of the above |
|
|
|
9.
|
Determine the equation of the quadratic regression function for the data.
x | 1 | 2 | 3 | 4 | 5 | y | 100.8 | 101.3 | 101.5 | 100.9 | 99.8 | | | | | | |
A. | y = –0.3x2 + 1.5x + 99.6 | B. | y =
–1.3x2 + 0.5x + 99.6 | C. | y =
–0.5x2 + 1.3x + 99.6 | D. | y =
–1.5x2 + 0.3x + 99.6 |
|
|
|
10.
|
Use cubic regression to interpolate the value of y when x = 5.
x | 1 | 2 | 3 | 4 | 6 | 7 | 8 | 9 | y | 12.4 | 30.3 | 41.1 | 55.7 | 68.9 | 83.0 | 101.3 | 125.5 | | | | | | | | | |
|
Short Answer
|
|
|
1.
|
How many x-intercepts and y-intercepts can a cubic function
have?
|
|
|
2.
|
Describe the characteristics of the trend in the data. x | 0 | 1 | 2 | 3 | 4 | 5 | 6 | 7 | y | –40 | –36 | –46 | –46 | –55 | –57 | –50 | –61 | | | | | | | | | |
|
|
|
3.
|
Determine the equation of the linear regression function for the data. Round all
values to the nearest tenth. x | –2.5 | –2.0 | –1.5 | –1.0 | –0.5 | 0 | 0.5 | y | 165 | 188 | 204 | 213 | 250 | 284 | 304 | | | | | | | | |
|
Problem
|
|
|
1.
|
Determine the following characteristics of the polynomial function
f(x) = –5(3 – 2x)(x + 1).
Show your work.
•
number of possible x-intercepts
• y-intercept
• end
behaviour
• domain
• range
• number of possible turning points
|
|
|
2.
|
The first 30 m of the path of a roller coaster can be modelled by the regression
equation
y = –0.008x3 + 0.35x2 – 4.35x
+ 38.50
where y represent the vertical distance in metres and x represents the
horizontal distance in metres.
a) Use your knowledge of polynomial functions to
describe the curve of this function.
b) Compare the heights of the points at x = 0,
x = 10, x = 20, and x = 30. What can you tell about the shape of the curve from
these values?
|