Multiple Choice
Identify the choice that best
completes the statement or answers the question.
|
|
|
1.
|
Determine the degree of this polynomial function: f( x) =  +
2 x
|
|
|
2.
|
Determine the leading coefficient of this polynomial
function:
f(x) = x2(x – 2x + 10)
|
|
|
3.
|
Determine the number of turning points of this polynomial
function:
f(x) = x2 – 5x – 1
|
|
|
4.
|
Determine the equation of this polynomial function: 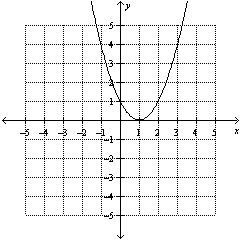 A. | f(x) = –x2 – 3x –
1 | B. | g(x) = x2 – 2x + 1 | C. | h(x) =
–x3 – 2x2 + 1 | D. | j(x) =
x3 + 2x |
|
|
|
5.
|
Fill in the blanks to describe the end behaviour of this polynomial
function: The curve extends from quadrant ____ to quadrant ____. 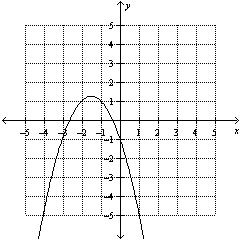 A. | II; I | B. | II; IV | C. | III;
I | D. | III; IV |
|
|
|
6.
|
The growth of a tree can be modelled by the function
h(t) =
2.3t + 0.45
where h represents the height in metres and t represents the time
in years.
Approximately how tall will the tree be in 8 years?
A. | 18.85 m | B. | 17.15 m | C. | 19.55
m | D. | 16.75 m |
|
|
|
7.
|
Use a ruler to help you estimate the y-intercept for a line that best
approximates the data in the scatter plot. 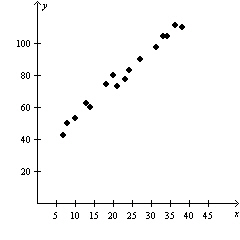
|
|
|
8.
|
Describe the characteristics of the trend in the data. x | 2 | 5 | 8 | 10 | 12 | 14 | 17 | 20 | y | 135 | 120 | 115 | 102 | 92 | 85 | 78 | 64 | | | | | | | | | |
A. | increasing | B. | decreasing | C. | constant | D. | no trend |
|
|
|
9.
|
Determine the equation of the linear regression function for the data. x | 2 | 5 | 8 | 10 | 12 | 14 | 17 | 20 | y | 135 | 120 | 115 | 102 | 92 | 85 | 78 | 64 | | | | | | | | | |
A. | y = 135 – 5x | B. | y = 139.5 –
4.5x | C. | y = 141.8 – 3.9x | D. | y = 142.7 –
3.2x |
|
|
|
10.
|
The path of a shot put thrown at a track and field meet is modelled by the
quadratic function
h(d) = –0.048(d2 – 20.7d
– 26.28)
where h is the height in metres and d is the horizontal distance in
metres.
How far has the shot put travelled when it finally hits the ground?
A. | 20.9 m | B. | 21.4 m | C. | 21.9
m | D. | 22.4 m |
|
Short Answer
|
|
|
1.
|
Determine the equation of the cubic regression function for the data. Round all
values to the nearest hundredth. x | –8 | –6 | –4 | –1 | 4 | 6 | 9 | 12 | 20 | y | 135 | 81 | 65 | 56 | 51 | 48 | 32 | 8 | –144 | | | | | | | | | | |
|
|
|
2.
|
Use quadratic regression to interpolate the value of y when x = 0.
Round your answer to the nearest tenth. x | –5 | –3 | –2 | 1 | 3 | 4 | 7 | y | 1.8 | 1.1 | 0.9 | 1.5 | 2.5 | 3.8 | 8.6 | | | | | | | | |
|
|
|
3.
|
Use cubic regression to extrapolate the value of y when x = 50.
Round your answer to the nearest whole number. x | 5 | 10 | 15 | 20 | 25 | 30 | 35 | 40 | y | 211 | 236 | 255 | 258 | 264 | 267 | 276 | 291 | | | | | | | | | |
|
Problem
|
|
|
1.
|
A bed-and-mattress retailer is planning to open another store. The location that
is being considered has 1650 sq ft of floor space. The retailer needs to know the number of display
beds they could have on the floor. Use the data from the retailer’s other locations to
extrapolate the number of beds they can display. Show your work. Number of Beds |
24
|
9
|
12
|
16
|
30
|
15
| Floor Space (sq ft) |
1250
|
700
|
840
|
1000
|
1420
|
1100
| | | | | | | |
|
|
|
2.
|
A farming cooperative collected data showing the effect of different amounts of
fertilizer, x, in hundreds of kilograms per hectare (kg/ha), on the yield of beets, y,
in tonnes (t). Use the data below and quadratic regression to compare the possible yields of beets
when the amount of fertilizer used is 1.50 kg/ha and 1.75 kg/ha. Show your work. Fertilizer
(kg/ha) |
0
|
0.25
|
0.50
|
0.75
|
1.00
|
1.25
| Yield (t) | 0.22 | 0.49 | 0.74 | 0.92 | 1.05 | 1.15 | | | | | | | |
|