Multiple Choice
Identify the choice that best
completes the statement or answers the question.
|
|
|
1.
|
What is the degree of a quadratic function?
|
|
|
2.
|
Determine the number of turning points on this polynomial function: 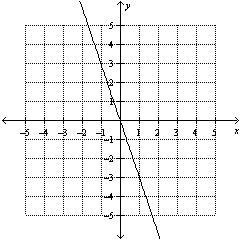
|
|
|
3.
|
Determine the degree of this polynomial function: f( x) =  +
2 x
|
|
|
4.
|
Determine the degree of this polynomial function:
f(x) =
x2(x – 2x + 10)
|
|
|
5.
|
Determine the equation of this polynomial function: 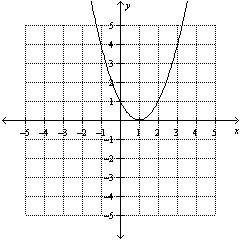 A. | f(x) = –x2 – 3x –
1 | B. | g(x) = x2 – 2x + 1 | C. | h(x) =
–x3 – 2x2 + 1 | D. | j(x) =
x3 + 2x |
|
|
|
6.
|
Use a ruler to help you estimate the slope for a line that best approximates the
data in the scatter plot. 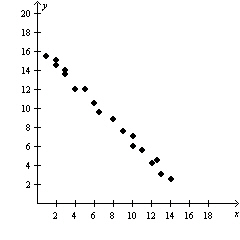
|
|
|
7.
|
Describe the characteristics of the trend in the data. 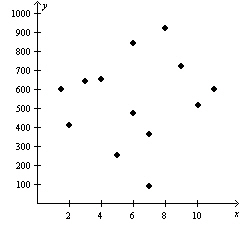 A. | increasing | B. | decreasing | C. | constant | D. | no trend |
|
|
|
8.
|
Describe the characteristics of the trend in the data. x | 2 | 5 | 8 | 10 | 12 | 14 | 17 | 20 | y | 135 | 120 | 115 | 102 | 92 | 85 | 78 | 64 | | | | | | | | | |
A. | increasing | B. | decreasing | C. | constant | D. | no trend |
|
|
|
9.
|
The average retail price of gas in Canada, from 1979 to 2008, can be modelled by
the function
P(y) = 0.008y3 – 0.307y2 +
4.830y + 25.720
where P is the price of gas in cents per litre and y is the
number of years after 1979.
During which year did the price of gas reach 50¢/L?
|
|
|
10.
|
Use quadratic regression to interpolate the value of y when x = 5.
x | 0 | 2 | 3 | 3 | 4 | 6 | 7 | 7 | y | 17.5 | 30.3 | 30.8 | 31.5 | 25.0 | 8.3 | –7.6 | –9.1 | | | | | | | | | |
|
Short Answer
|
|
|
1.
|
Use a ruler to help you estimate the y-intercept for a line that best
approximates the data in the scatter plot. 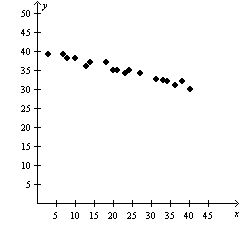
|
|
|
2.
|
Determine the equation of the linear regression function for the data. Round all
values to the nearest hundredth. x | 0 | 1 | 2 | 3 | 4 | 5 | 6 | 7 | y | –43 | –44 | –46 | –46 | –48 | –47 | –50 | –51 | | | | | | | | | |
|
|
|
3.
|
Determine the equation of the quadratic regression function for the data. Round
all values to the nearest hundredth. x | 1.5 | 2 | 2.5 | 3 | 3.5 | 4 | 4.5 | 5 | y | –6.8 | –6.4 | –6.6 | –7.3 | –8.5 | –10.2 | –12.8 | –16.0 | | | | | | | | | |
|
Problem
|
|
|
1.
|
|
|
|
2.
|
A large bicycle retailer collects data on the number of bicycles in each store
compared to floor space of each store. The data is given in the table below. Number of Bicycles |
60
|
56
|
208
|
52
|
70
|
55
| Floor Space (sq ft) |
1400
|
1140
|
3250
|
1100
|
1500
|
1280
| | | | | | | |
a) Determine the
equation of the linear regression function. b) What do the slope and x-intercept
represent in this context? c) Estimate the number of bicycles in a store with 2500 sq ft of
floor space.
|