Multiple Choice
Identify the
choice that best completes the statement or answers the question.
|
|
|
1.
|
What are the x- and y-intercepts for the function
f(x) = x2 + 5x + 6?
a. | x = –4, x = –2, y = 6 | b. | no
x-intercepts, y = 6 | c. | x = –2.5, y =
6 | d. | x = –3, x = –2, y =
6 |
|
|
|
2.
|
Rewrite x2 + x = –x + 3 in standard
form. Then solve the equation in standard form by graphing.
a. | x = –3, x = 1 | b. | x = 3, x = 1 | c. | x =
–3, x = –3 | d. | x = 3, x =
–1 |
|
|
|
3.
|
Which relation is the factored form of f(x) = x2
– 4x + 4?
a. | f(x) = (x – 2)(x + 2) | b. | f(x) =
4(x – 1)2 | c. | f(x) = (x +
4)(x – 1) | d. | f(x) = (x –
2)2 |
|
|
|
4.
|
Solve 2x2 = 7x – 6 by factoring.
a. | x = 2, x = 3 | b. | x = –2, x = – | c. | x = 2, x =  | d. | x = 6, x =
–1 |
|
|
|
5.
|
Solve 12w2 + 8w = –7w2
– 3w + 14 by factoring.
|
|
|
6.
|
How many zeros does f(x) = a(x –
2)2 + 5 have if a > 0?
a. | 2 | b. | 0 | c. | 1 | d. | It is impossible to
determine. |
|
|
|
7.
|
Solve –3x2 + 4x + 1 = 0 using the quadratic
formula.
a. | x = 1, x = – | b. | x = 1, x
=  | c. | x = –1, x =  | d. | x =
–1, x = – |
|
|
|
8.
|
Ben dives off a 7 m platform. He reaches a maximum height of 7.3 m after 0.27 s.
How long does it take him to reach the water?
a. | 1.55 s | b. | 1.45 s | c. | 1.60
s | d. | 1.40 s |
|
|
|
9.
|
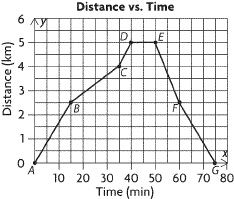
The graph shows how a cyclist travels over time. Over which interval is the
cyclist travelling the fastest?
|
|
|
10.
|
The graph shows how a cyclist travels over time.
Over which interval
is the cyclist travelling at 0 km/h?

|
|
|
11.
|
Which scale factor(s) will produce an image that is larger than the
original? I. 0.86 II. 116% III.  a. | I only | b. | I and II only | c. | II and III
only | d. | I, II, and III |
|
|
|
12.
|
Stop signs have a standard width of 60 cm.
Measure the scale diagram
of the stop sign to determine which scale factor was used to draw
it.
 a. |  | b. | 8.3% | c. |  | d. | 7.5% |
|
|
|
13.
|
A photograph is 6 cm by 11 cm. A copy is made
using a scale factor of 140%. What are the dimensions of the copy?
a. | 4.3 cm by 7.9 cm | b. | 8.4 cm by 15.4 cm | c. | 24 cm by 44
cm | d. | 43 mm by 79 cm |
|
|
|
14.
|
The distance between two towns on a map is 5.4
cm. The map was made using a scale of 1 cm to 300 km. What is the actual distance between the two
towns?
a. | 1600 km | b. | 1550 km | c. | 1620
km | d. | 1520 km |
|
|
|
15.
|
Data for triangle ABC is shown on the first line of the table.
Triangle ABC is reduced so the height is 1.5 cm. Which triangle is the reduction of
triangle ABC? Triangle Name | Length of Base (cm) | Height of Triangle (cm) | Scale Factor | Area (cm2) | | ABC | 5.0 | 3.0 | 1.0 | 7.5 | 1.00 | DEF | 10.0 | 1.5 | 2.0 | 2.5 | 4.00 | GHI | 1.5 | 1.5 | 0.5 | 3.0 | 0.25 | JKL | 2.5 | 1.5 | 0.5 | 1.875 | 0.25 | MNO | 2.5 | 1.5 | 0.25 | 1.75 | 0.50 | | | | | | |
|
|
|
16.
|
Data for circle O is shown on the first line of the table. Circle
O is reduced by a scale factor of 0.2. Which circle is the reduction of circle
O? Circle Name | Radius (cm) | Scale Factor | Area (cm2) | | O | 24.0 | 1 | 1809.56 | 1 | P | 3.6 | 0.2 | 82.73 | 0.03 | Q | 2.3 | 0.2 | 62.38 | 0.04 | R | 4.8 | 0.2 | 72.38 | 0.04 | S | 2.3 | 0.2 | 82.73 | 0.03 | | | | | |
|
|
|
17.
|
Data for rectangle ABCD is shown on the first line of the table.
Rectangle ABCD is reduced to an area of 13 cm 2. Which rectangle is the
reduction of rectangle ABCD?
Rectangle Name | Length (cm) | Width (cm) | Scale Factor | Area (cm2) | | ABCD | 9 | 13 | 1 | 117 | 1 | EFGH | 3 | 4 | | 13 | | JKLM | 4 | | | 13 | | NOPQ | 1 | | | 13 | | RSTU | 3 | | | 13 | | | | | | | |
|
|
|
18.
|
Which one of the following cylinders is similar
to a cylinder that is 8 cm long and 2.5 cm in diameter? Choose the best answer.
a. | a cylinder 4 cm long and 1.5 cm in diameter | b. | a cylinder 12 cm
long and 3.5 cm in diameter | c. | a cylinder 16 cm long and 5 cm in
diameter | d. | all of the above |
|
|
|
19.
|
A 1:25 scale model of a garbage truck is 0.5 ft
tall, 0.32 ft wide, and 1.4 ft long. What are the dimensions of the actual garbage
truck?
a. | 25 ft by 12.5 ft by 50 ft | b. | 9 ft by 6.4 ft by 25 ft | c. | 15 ft by 7.4 ft by
33.5 ft | d. | 12.5 ft by 8 ft by 35 ft |
|
|
|
20.
|
Cylinder A has a radius of 5 mm and a height of 30 mm.
Cylinder B has a
radius of 20 mm and a height of 120 mm.
These two cylinders are similar.
By what factor is the
volume of cylinder B greater than the volume of cylinder A?
|
Short Answer
|
|
|
21.
|
Fill in the table for the relation y = – x2
– 3 x. | Maximum or minimum | | | Axis of symmetry | | | Vertex | | | |
|
|
|
22.
|
Solve x2 + 6x + 4 = 0 using the quadratic
formula. Verify by graphing.
|
|
|
23.
|
Anna reduces this figure by a scale factor of  . Determine the area of
the reduced figure, to the nearest tenth of a square unit. 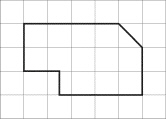
|
|
|
24.
|
Jamia reduces this figure by a scale factor of  . Determine the area of
the figure, to the nearest tenth of a square unit. 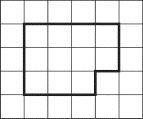
|
|
|
25.
|
The giant statue of a white fox in White Fox, SK, is 2.7 m long and 1.4 m tall.
Suppose the town council wants to create scale models of the
statue that are 15 cm long to sell to tourists.
What scale factor should they use?
|
Problem
|
|
|
26.
|
a) Solve 3x2 + 5x – 2 = 0 using the
quadratic formula.
b) Solve the equation by factoring.
|
|
|
27.
|
A company manufactures aluminum cans. One customer places an order for cans that
must be 19 cm high, with a volume of 3358 cm3.
a) Use a method of your choice to
determine the radius that the company should use to manufacture these cans.
b) Explain why
you choose this method.
|
|
|
28.
|
The following table shows the attendance for the Calgary Stampede over several
years. a) If you were to graph this data, would you use exact or rounded figures?
Explain. b) What scale would you use? c) Draw a graph of the data. Year | Attendance | 2004 | 1 221
182 | 2005 | 1 242 928 | 2006 | 1 262 518 | 2007 | 1 251
105 | 2008 | 1 236 351 | 2009 | 1 186 636 | 2010 | 1 145
394 | | |
|
|
|
29.
|
A window in a clothing store is 6.00 ft high and 15.00 ft long. Lee has been
asked to paint a mural on the window. The mural must be  the area of the window and the mural and
window must be similar. The mural must also be centred on the window. Draw a scale diagram that shows
the dimensions of the window, the dimensions of the mural, and where the mural should be
placed.
|
|
|
30.
|
Yield signs on city, town, and rural roads are equilateral triangles pointing
downward. Describe how you would create a similar yield sign that is one-ninth the area of a typical
yield sign to use as a collectable novelty.
|