Multiple Choice
Identify the
choice that best completes the statement or answers the question.
|
|
|
1.
|
Environment Canada compiled data on the number of lightning strikes per square
kilometre in Alberta and British Columbia towns from 1999 to
2008.
0.42 0.04
0.81 0.40
0.03 0.74
0.28
0.03 0.70
0.23 0.03
0.66
0.13 0.02
0.61 0.12
0.01 0.58
0.10
0.00 0.49
0.07 1.08
0.43
0.05 0.91
0.42 0.04 0.88
Which range of data
occurs most frequently?
a. | 0.20–0.29 | b. | 0.10–0.19 | c. | 0.00–0.09 | d. | 0.30–0.39 |
|
|
|
2.
|
Environment Canada compiled data on the number of lightning strikes per square
kilometre in Alberta and British Columbia towns from 1999 to
2008.
0.42 0.04
0.81 0.40
0.03 0.74
0.28
0.03 0.70
0.23 0.03
0.66
0.13 0.02
0.61 0.12
0.01 0.58
0.10
0.00 0.49
0.07 1.08
0.43
0.05 0.91
0.42 0.04 0.88
Which range of data
occurs most frequently?
a. | 0.20–0.39 | b. | 0.40–0.59 | c. | 0.60–0.79 | d. | 0.80–0.99 |
|
|
|
3.
|
A pear orchard has 20 trees with these heights, given in
inches.
110
83 104
95
88
80 115
106
97
100 98
93
92
117 75
83
122
115 89 105
Determine the mean, to
one decimal place.
a. | 99.4 in. | b. | 101.4 in. | c. | 98.4
in. | d. | 100.4 in. |
|
|
|
4.
|
Environment Canada recorded the amount of rain (in millimetres) in Victoria, BC
for two months.
0 0
9.0 0 0
1.0 0
0
0 7.6 0
0 5.8
0.6
0 0
0.4 0 0
0
0 0 0
0 0 0
0
0 0 0
0 0
0 0
0 0 0
0.4
0 5.8
0 0 1.6
0.2
0 6.0
0 0 0.2
0
0 0.2
0 0 1.0
0
0 2.8
0 0 26.0
0
Determine the standard deviation, to one decimal place.
a. | 8.9 mm | b. | 3.7 mm | c. | 0.0
mm | d. | 1.2 mm |
|
|
|
5.
|
Environment Canada compiled data on the number of lightning strikes per square
kilometre in Saskatchewan and Manitoba towns from 1999 to 2008.
2.03
1.31 0.25
1.03 1.20
0.17
0.99 1.01
0.24 0.94
0.92 0.09
0.86
0.71 0.05
0.81 0.63
0.01
0.80 0.58
0.00 0.72
0.49 0.52
0.43
0.46 0.40
Determine the standard deviation, to two decimal
places.
|
|
|
6.
|
The ages of participants in a bonspiel are normally distributed, with a mean of
40 and a standard deviation of 10 years. What percent of the curlers are between 30 and
50?
|
|
|
7.
|
Determine the percent of data to the left of the z-score: z =
–1.50.
a. | 8.08% | b. | 6.68% | c. | 6.81% | d. | 7.35% |
|
|
|
8.
|
Determine the percent of data to the right of the z-score: z =
–0.08.
a. | 78.81% | b. | 46.81% | c. | 21.19% | d. | 53.19% |
|
|
|
9.
|
Determine the percent of data between the following z-scores:
z
= –2.25 and z = 1.75.
a. | 95.99% | b. | 94.77% | c. | 93.55% | d. | 97.23% |
|
|
|
10.
|
The results of a survey have a confidence interval of 56.0% to 64.6%, 9 times
out of 10.
Determine the margin of error.
a. | ±16.6% | b. | ±64.6% | c. | ±56.0% | d. | ±8.3% |
|
|
|
11.
|
The results of a survey have a confidence interval of 4.8% to 7.2%, 19 times out
of 20.
Determine the margin of error.
a. | ±2.4% | b. | ±1.4% | c. | ±0.7% | d. | ±1.2% |
|
|
|
12.
|
Which test point is in the solution set for the linear inequality
{( x, y) | 5 x – 2 y  10, x  R, y  R}? a. | (5, 2) | b. | (2, 5) | c. | (1,
0) | d. | (0, 1) |
|
|
|
13.
|
How would you graph the solution set for the linear inequality 2 y
– 2 x  10? a. | Draw a dashed boundary line y = x + 5, then shade below the
line. | b. | Draw a dashed boundary line y = x + 5, then shade above the
line. | c. | Draw a solid boundary line y = x + 5, then shade below the
line. | d. | Draw a solid boundary line y = x + 5, then shade above the
line. |
|
|
|
14.
|
Identify the point of intersection for the following system of linear
inequalities. {2 y – 6 x < 12, 4 x + 4 y  8, x  I, y  I} a. | (–3, 1) | b. | (–1, 3) | c. | (3,
–1) | d. | (1, –3) |
|
|
|
15.
|
Describe the boundary lines for the following system of linear
inequalities. {2 y – 6 x < 12, 4 x + 4 y  8, x  I, y  I} a. | Dashed line along y = 3x + 6; dashed line along y = 2 –
x | b. | Dashed line along y = 3x + 6; solid line along y = 2 –
x | c. | Solid line along y = 3x + 12; dashed line along y = 2 –
x | d. | Solid line along y = 3x + 12; solid line along y = 2 –
x |
|
|
|
16.
|
Which test point is in the solution set for the following system of linear
inequalities? {2 x – 5 y < 2, x + y < 0, x  R, y  R} a. | (–1, –1) | b. | (1, 1) | c. | (10,
0) | d. | (0, 10) |
|
|
|
17.
|
What system of linear inequalities is shown here? 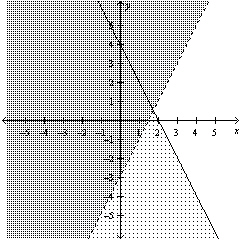 a. | 2x + y  4 4
y <
2x – 3 | b. | 2x + y  4 4
y > 2x
– 3 | c. | 2x + y  4 4
y >
2x – 3 | d. | 2x + y  4 4
y < 2x
– 3 |
|
|
|
18.
|
A vending machine sells juice and pop.
• The machine holds, at most,
200 cans of drinks.
• Sales from the vending machine show that at least 3 cans of juice are
sold for each can of pop.
• Each can of juice sells for $1.50, and each can of pop sells for
$1.00.
Let x represent the number of cans of pop.
Let y represent the number of
cans of juice.
What are the restrictions on x and y?
a. | x Î W, y Î W | b. | x Î I,
y Î I | c. | x Î R,
y Î R | d. | No constraints. |
|
|
|
19.
|
The following model represents an optimization problem. Determine the maximum
solution. Restrictions: x  W y  W Constraints: 0  x x  100 –50  y y 
50  x x  25 – yx – y
 60 Objective function: A = y
– 2 x + 10
a. | (34, 4) | b. | (0, 25) | c. | (68,
8) | d. | (–10, –50) |
|
|
|
20.
|
Audrey notices the number of people and dogs in a dog park.
• There
are more people than dogs.
• There are at least 12 dogs.
• There are no more than
40 people and dogs, in total.
• All the dogs have four legs and all the people have two
legs.
What is the maximum number of legs at the park?
|
Short Answer
|
|
|
21.
|
Environment Canada compiled data on the number of lightning strikes per square
kilometre in Saskatchewan and Manitoba towns from 1999 to 2008.
2.03
1.31 0.25
1.03 1.20
0.17
0.99 1.01
0.24 0.94
0.92 0.09
0.86
0.71 0.05
0.81 0.63
0.01
0.80 0.58
0.00 0.72
0.49 0.52
0.43
0.46 0.40
If the interval width is 0.25 and starts at 0.00, how
many intervals are there?
|
|
|
22.
|
Four groups of students recorded their pulse rates after a 2 km run. | Group
1 | 126 | 168 | 158 | 192 | 146 | 166 | 104 | 164 | 116 | 138 | 172 | 136 | 152 | 128 | | Group 2 | 158 | 132 | 156 | 160 | 108 | 150 | 178 | 136 | 172 | 140 | 126 | 154 | 130 | 160 | | Group 3 | 136 | 174 | 156 | 176 | 150 | 166 | 142 | 156 | 130 | 182 | 180 | 166 | 148 | 172 | | Group 4 | 144 | 150 | 142 | 152 | 174 | 176 | 118 | 152 | 178 | 164 | 128 | 158 | 158 | 166 | | | | | | | | | | | | | | | |
Determine the standard deviation of Group 2, to one decimal
place.
|
|
|
23.
|
Four groups of students recorded their pulse rates after a 2 km run. | Group
1 | 126 | 168 | 158 | 192 | 146 | 166 | 104 | 164 | 116 | 138 | 172 | 136 | 152 | 128 | | Group 2 | 158 | 132 | 156 | 160 | 108 | 150 | 178 | 136 | 172 | 140 | 126 | 154 | 130 | 160 | | Group 3 | 136 | 174 | 156 | 176 | 150 | 166 | 142 | 156 | 130 | 182 | 180 | 166 | 148 | 172 | | Group 4 | 144 | 150 | 142 | 152 | 174 | 176 | 118 | 152 | 178 | 164 | 128 | 158 | 158 | 166 | | | | | | | | | | | | | | | |
Determine the standard deviation of Group 4, to one decimal
place.
|
|
|
24.
|
A poll was conducted about an upcoming election. The results are considered
accurate within ±4.0 percent points, 9 times out of 10.
State the confidence level.
|
|
|
25.
|
Baskets of fruit are being prepared to sell.
• Each basket contains at
least 8 apples and more than 4 oranges.
• Apples cost 25¢ each, and oranges cost
40¢ each.
• The budget allows no more than $6, in total, for the fruit in each
basket.
Let x represent the number of apples.
Let y represent the number of
oranges.
Write a linear inequality to represent the cost of each basket (in dollars).
|
Problem
|
|
|
26.
|
A manufacturer collects data on the lifespan of their irons, in years.
4.0 2.8
6.8 7.0 6.8
5.8 5.0 6.0
4.2 5.4
7.0
4.8 7.4 5.0
6.0 7.8 4.6
5.2 6.4
5.0
5.4 5.8
6.2 6.2 5.6
6.4 6.4 6.6
4.8 5.8
5.8
5.4 5.2 5.6
6.2 4.4 6.4
5.6 6.0
6.2
5.2 5.8
7.6 4.6 5.6
5.6 6.4 6.0
6.4 4.8
4.4
3.2 7.2 7.4
7.2 6.2 5.4
6.4 4.6
5.8
7.4 5.2
7.8 5.4 6.4
8.2 5.0 5.6
6.8 5.4
a) Determine the mean and the standard
deviation.
b) Draw a frequency polygon to show the data.
c) Does the data have a
normal distribution? Explain.
|
|
|
27.
|
The mass of an adult female Kodiak bear is generally in the range of 500 kg to
700 kg with a standard deviation of 50 kg. Male Kodiak bears typical weigh about 40% more than the
females. Assuming that the data is normally distributed, determine the mean and standard deviation
for the mass of an adult male Kodiak bear. Justify your answers.
|
|
|
28.
|
Indy volunteers to fold origami cranes and swans for a display.
• She
has 20 squares of white paper for the cranes and swans.
• It takes her 5 min to fold an
origami crane and 4 min to fold an origami swan.
• There must be at least two swans for
every crane.
• Indy needs a 10 minute break halfway through the job.
She wants to
minimize the time spent doing origami.
a) Create a model to represent this
situation.
b) Suppose that Indy’s given another 5 squares of origami paper. How would
your model change?
|
|
|
29.
|
Three teams are travelling to a hockey tournament in cars and
minivans. • Each team has no more than 2 coaches and 18 athletes. • Each car can
take 3 team members, and each minivan can take 5 team members. • No more than 7 minivans and
15 cars are available. The school wants to know the combination of cars and minivans that will
require the maximum number of vehicles. Create and verify a model to represent this
situation. a) Use the optimization model to determine the combination of cars and minivans
that will use the maximum number of vehicles. b) How many team members can travel in the
maximum number of vehicles? Optimization Model
Let V represent the total number
of vehicles. Let c represent the number of cars. Let m represent the number of
minivans. Restrictions: c Î W, m Î W Constraints: c 
0 m  0 3 c + 5 m  60 c 
15 m  7 Objective function to maximize: V =
c + m
|
|
|
30.
|
A refinery produces oil and gas. • At least 1.5 L of gasoline are
produced for each litre of heating oil. • The refinery can produce up to 8.5 million litres
of heating oil and 4 million litres of gasoline each day. • Gasoline is projected to sell
for $1.05 per litre. Heating oil is projected to sell for $1.90 per litre. The company needs to
determine the daily combination of gas and heating oil that must be produced to maximize revenue.
Create a model to determine this combination. What would the revenue be? Optimization
Model
Let g represent the number of millions of litres of gasoline. Let h
represent the number of millions of litres of heating oil. Let R represent the total
revenue from sales in millions of dollars. Restrictions: g Î R, h Î R Constraints: g
 0 h 
0 g  1.5 hg  4 h  8.5 Objective function to
maximize: R = 1.05 g + 1.90 h
|