Multiple Choice
Identify the
choice that best completes the statement or answers the question.
|
|
|
1.
|
Determine the range of the following test scores.
History Test 2 Scores (out
of 100)
95 85
72 62
92
84 72
59
89 80
70 52
88
78 68
40
85 73
67 32
|
|
|
2.
|
Environment Canada compiled data on the number of lightning strikes per square
kilometre in Alberta and British Columbia towns from 1999 to
2008. 0.42 0.04
0.81 0.40
0.03 0.74 0.28
0.03 0.70
0.23 0.03
0.66 0.13 0.02
0.61 0.12
0.01 0.58 0.10
0.00 0.49
0.07 1.08
0.43 0.05 0.91
0.42 0.04 0.88 What value goes in
the fourth row of this frequency table? Lightning Strikes (per square
kilometre) |
Frequency
| 0.00–0.19 | 13 | 0.20–0.39 | 2 | 0.40–0.59 | 6 | 0.60–0.79 | | 0.80–0.99 | 3 | 1.00–1.19 | 1 | | |
|
|
|
3.
|
A pear orchard has 20 trees with these heights, given in
inches.
110
83 104
95
88
80 115
106
97
100 98
93
92
117 75
83
122
115 89 105
Determine the mean, to
one decimal place.
a. | 99.4 in. | b. | 101.4 in. | c. | 98.4
in. | d. | 100.4 in. |
|
|
|
4.
|
A pear orchard has 20 trees with these heights, given in
inches.
110
83 104
95
88
80 115
106
97
100 98
93
92
117 75
83
122
115 89 105
Determine the standard
deviation, to one decimal place.
a. | 9.0 in. | b. | 11.0 in. | c. | 13.0
in. | d. | 15.0 in. |
|
|
|
5.
|
Environment Canada recorded the amount of rain (in millimetres) in Victoria, BC
for two months.
0 0
9.0 0 0
1.0 0
0
0 7.6 0
0 5.8
0.6
0 0
0.4 0 0
0
0 0 0
0 0 0
0
0 0 0
0 0
0 0
0 0 0
0.4
0 5.8
0 0 1.6
0.2
0 6.0
0 0 0.2
0
0 0.2
0 0 1.0
0
0 2.8
0 0 26.0
0
Determine the standard deviation, to one decimal place.
a. | 8.9 mm | b. | 3.7 mm | c. | 0.0
mm | d. | 1.2 mm |
|
|
|
6.
|
Which set is normally distributed? | Interval | 0–9 | 10–19 | 20–29 | 30–39 | 40–49 | 50–59 | | Set A. | 100 | 500 | 850 | 820 | 450 | 150 | | Set B. | 800 | 750 | 700 | 650 | 600 | 550 | | Set C. | 950 | 420 | 180 | 220 | 460 | 990 | | Set D. | 400 | 620 | 760 | 820 | 900 | 850 | | | | | | | |
a. | Set A. | b. | Set C. | c. | Set
D. | d. | Set B. |
|
|
|
7.
|
Determine the percent of data to the left of the z-score: z =
–1.50.
a. | 8.08% | b. | 6.68% | c. | 6.81% | d. | 7.35% |
|
|
|
8.
|
The results of a survey have a confidence interval of 28% to 34%, 19 times out
of 20.
Determine the margin of error.
|
|
|
9.
|
Which test point is in the solution set for the linear inequality
{( x, y) | 7 x + 5 y  0, x  I, y  I}? a. | (2, 2) | b. | (–1, –1) | c. | (1,
1) | d. | (2, –2) |
|
|
|
10.
|
What system of linear inequalities is shown here? 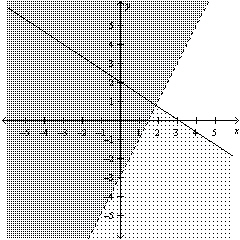 a. | 2x + 3y £ 6
y >
2x – 3 | b. | 2x + 3y < 6
y
> 2x – 3 | c. | 2x + 3y < 6
y
 2x – 3 2x – 3 | d. | 2x + 3y ? 6
y  2x – 3
 |
|
|
|
11.
|
What system of linear inequalities is shown here? 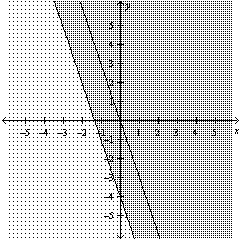 a. | 3x + y  0 0
y + 4  3x 3x | b. | 3x
+ y < 0
y + 4  3x 3x | c. | 3x + y < 0
y
– 4 > 3x | d. | 3x + y > 0
y +
4  3x 3x |
|
|
|
12.
|
Which test point is in the solution set for the following system of linear
inequalities? {2 x – 5 y < 2, x + y < 0, x  R, y  R} a. | (–1, –1) | b. | (1, 1) | c. | (10,
0) | d. | (0, 10) |
|
|
|
13.
|
A vending machine sells juice and pop.
• The machine holds, at most,
200 cans of drinks.
• Sales from the vending machine show that at least 3 cans of juice are
sold for each can of pop.
• Each can of juice sells for $1.50, and each can of pop sells for
$1.00.
Let x represent the number of cans of pop.
Let y represent the number of
cans of juice.
How would you write the objective function for revenue, R?
a. | R = x + 1.50y | b. | R = 1.25x +
y | c. | R = 1.50(x + y) | d. | R = 1.50y –
x |
|
|
|
14.
|
The following model represents an optimization problem. Determine the maximum
solution. Restrictions: x  W y  W Constraints: y  0 x  y y
+ 10 2 x + y  80 Objective
function: T = 2 y – x
a. | (40, 0) | b. | (30, 20) | c. | (0,
40) | d. | (40, 30) |
|
|
|
15.
|
Brent found spiders and grasshoppers in his barn.
• There were at most
15 spiders and at most 20 grasshoppers.
• There were no more than 30 spiders and
grasshoppers, in total.
Let s represent the number of spiders and let g represent
the number of grasshoppers.
Which inequality represents a restriction of s and g
based on the given information?
|
Short Answer
|
|
|
16.
|
Environment Canada compiled data on the number of lightning strikes per square
kilometre in Quebec towns from 1999 to 2008.
1.41
0.96 0.48
0.30 0.03
1.32
0.90 0.47
0.19 0.02
1.25
0.71 0.29
0.18 0.02
1.11
0.57 0.49
0.15 0.00
1.02
0.41 0.10
0.11
1.01
0.17 0.49
0.08
0.98
0.99 0.32
0.04
Determine the standard deviation, to two decimal
places.
|
|
|
17.
|
The ages of members in a hiking club are normally distributed, with a mean of 32
and a standard deviation of 6 years. What percent of the members are between 26 and 32?
|
|
|
18.
|
Determine the percent of data to the right of the z-score: z =
1.60.
|
|
|
19.
|
Is the point (–2, 2) in the solution set for the linear inequality
10y – 12x > 5?
|
|
|
20.
|
A system of linear inequalities has vertices at (2, 4), (–2, 5), and (0,
0). Which point represent the maximum value of the objective function Z = 4 y +  x x?
|
Problem
|
|
|
21.
|
a) Use confidence intervals to interpret the following statement and
apply the result to a graduating class of 1400 students.
In a recent survey, 72% of post-secondary
graduates indicated that they expected to earn at least $6000/month by the time they were ready to
retire. The survey is considered accurate within ±5.2%, 19 times in 20.
b) How could
they increase the confidence level of their result?
|
|
|
22.
|
An advertisement for a new toothpaste states that 80% of users reported better
dental check-ups. The results of the poll are accurate within 4 percent points, 9 times out of
10.
a) State the confidence level.
b) Determine the confidence interval.
c)
In a focus group of 50 students, four said they already used this toothpaste and another five did
not want to try it. Determine the range of the mean number of the remaining students who could expect
better dental check-ups.
|
|
|
23.
|
Two different market research companies conducted a survey on the same issue.
Company A used a 90% confidence level and company B used a 95% confidence level.
a) If both
companies used the same sample size, what does this imply about the margin of error for each
survey?
b) If both companies used the same margin of error of ±3.5%, what does this
imply about the sample size for each survey?
|
|
|
24.
|
Four teams are travelling to a lacrosse tournament in cars and
minivans. • Each team has no more than 2 coaches and 13 athletes. • Each car can
take 4 team members, and each minivan can take 7 team members. • No more than 5 minivans and
8 cars are available. The school wants to know the combination of cars and minivans that will require
the maximum number of vehicles. Create and verify a model to represent this situation. a)
Use the optimization model to determine the combination of cars and minivans that will use the
maximum number of vehicles. b) How many team members can travel in the maximum number of
vehicles? Optimization Model
Let V represent the total number of
vehicles. Let c represent the number of cars. Let m represent the number of
minivans. Restrictions: c Î W, m Î W Constraints: c 
0 m  0 4 c + 7 m  60 c  8 m  5 Objective function to maximize: V =
c + m
|
|
|
25.
|
The stylists in a hair salon cut hair for women and men.
• The salon
books at least 3 women’s appointments for every man’s appointment.
• Usually
there are 120 or more appointments, in total, during a week.
• The salon is trying to reduce
the number of hours the stylists work.
• A woman’s cut takes about 60 min, and a
man’s cut takes about 25 min.
What combination of women’s and men’s appointments
would minimize the number of hours the stylists work? How many hours would this be?
|