Multiple Choice
Identify the
choice that best completes the statement or answers the question.
|
|
|
1.
|
Determine the mean of the following test scores.
History Test 2 Scores (out
of 100)
95 85
72 62
92
84 72
59
89 80
70 52
88
78 68
40
85 73
67 32
a. | 71.15 | b. | 70.65 | c. | 71.65 | d. | 72.15 |
|
|
|
2.
|
A pear orchard has 40 trees with these heights, given in
inches. 110
105 83 84
104 92 95
98 88
92 80 81
115 88 106
92 97
103 100 93
98 93 93
102 92
87 117 92
75 102 83
107 122
92 115 86
89 98 105
125 What value goes in the second row of this frequency table? Height (in.) | Frequency | 70–79 | 1 | 80–89 | | 90–99 | 14 | 100–109 | 9 | 110–119 | 4 | 120–129 | 2 | | |
|
|
|
3.
|
A company measured the lifespan of a random sample of 30 light bulbs. Times are
in hours. 985
1001 1024
1087 952
910 938 931
1074 1081
1078 1080
982 1108
1022 937
922 1017
1093 1115
880 1048
917 1086
935 936
986 1038
954 966 What value goes in the fourth row of this frequency
table? Lifespan (hours) | Frequency | 850–899 | 1 | 900–949 | 8 | 950–999 | 6 | 1000–1049 | | 1050–1099 | 7 | 1100–1149 | 2 | | |
|
|
|
4.
|
The ages of participants in a bonspiel are normally distributed, with a mean of
40 and a standard deviation of 10 years. What percent of the curlers are between 40 and
50?
|
|
|
5.
|
The ages of participants in a bonspiel are normally distributed, with a mean of
40 and a standard deviation of 10 years. What percent of the curlers are older than 60?
|
|
|
6.
|
Determine the z-score for the given value.
µ = 184, s = 8.6, x = 174
a. | –0.86 | b. | 0.86 | c. | 1.16 | d. | –1.16 |
|
|
|
7.
|
Determine the percent of data to the right of the z-score: z =
–0.08.
a. | 78.81% | b. | 46.81% | c. | 21.19% | d. | 53.19% |
|
|
|
8.
|
Determine the percent of data between the following z-scores:
z
= 0.40 and z = 1.80.
a. | 30.87% | b. | 22.66% | c. | 15.44% | d. | 7.72% |
|
|
|
9.
|
A poll was conducted about an upcoming election. The result that 30% of people
intend to vote for one of the candidates is considered accurate within ±4.5 percent points, 19
times out of 20.
State the confidence interval.
a. | 25.5%–34.5% | b. | 27.5%–36.5% | c. | 26.5%–35.5% | d. | 24.5%–33.5% |
|
|
|
10.
|
Which sample size will have the least margin of error?
a. | 3000 | b. | 1000 | c. | 2000 | d. | It is impossible to
tell. |
|
|
|
11.
|
For which inequality is (5, 0) a possible solution?
a. | y > 9 | b. | y < x
– 2 | c. | y  9 – 2x 9 – 2x | d. | y
– 2x  10 10 |
|
|
|
12.
|
Which test point is in the solution set for the linear inequality
{( x, y) | 7 x + 5 y  0, x  I, y  I}? a. | (2, 2) | b. | (–1, –1) | c. | (1,
1) | d. | (2, –2) |
|
|
|
13.
|
Identify the point of intersection for the following system of linear
inequalities. { y – 3 x < 12, x + y  0, x  R, y 
R} a. | (3, –3) | b. | (1, –1) | c. | (–1,
1) | d. | (–3, 3) |
|
|
|
14.
|
Identify the point of intersection for the following system of linear
inequalities. { y  2 + x, x + y  0, x
 R, y 
R} a. | (1, –1) | b. | (3, –3) | c. | (–3,
3) | d. | (–1, 1) |
|
|
|
15.
|
Describe the boundary lines for the following system of linear
inequalities. {2 y – 6 x < 12, 4 x + 4 y  8, x  I, y  I} a. | Dashed line along y = 3x + 6; dashed line along y = 2 –
x | b. | Dashed line along y = 3x + 6; solid line along y = 2 –
x | c. | Solid line along y = 3x + 12; dashed line along y = 2 –
x | d. | Solid line along y = 3x + 12; solid line along y = 2 –
x |
|
|
|
16.
|
Which point in the model below would result in the maximum value of the
objective function W = 5 y – 10 x? 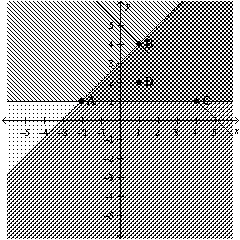 a. | B (1, 4) | b. | C (4, 1) | c. | A (–2,
1) | d. | D (1, 2) |
|
|
|
17.
|
The following model represents an optimization problem. Determine the maximum
solution. Restrictions: x  R y  R Constraints: x  4 x – y  12 x + 3 y  24 Objective function: G = x – 2 y
a. | (4, –2) | b. | (8, –2) | c. | (4,
–8) | d. | (12, 0) |
|
|
|
18.
|
Brent found spiders and grasshoppers in his barn.
• There were at most
15 spiders and at most 20 grasshoppers.
• There were no more than 30 spiders and
grasshoppers, in total.
Let s represent the number of spiders and let g represent
the number of grasshoppers.
Which inequality represents a restriction of s and g
based on the given information?
|
|
|
19.
|
Brent found spiders and grasshoppers in his barn.
• There were at most
15 spiders and at most 20 grasshoppers.
• There were no more than 30 spiders and
grasshoppers, in total.
• All the spiders had eight legs and all the grasshoppers had six
legs.
What is the maximum number of legs on all the spiders and grasshoppers in his barn?
|
|
|
20.
|
Audrey notices the number of people and dogs in a dog park.
• There
are more people than dogs.
• There are at least 12 dogs.
• There are no more than
40 people and dogs, in total.
Let d represent the number of dogs and let p represent
the number of people.
Which inequality represents a restriction of d and p based on
the given information?
a. | d + p  40 40 | b. | d + p
< 40 | c. | d + p  40 40 | d. | d + p
> 40 |
|
Short Answer
|
|
|
21.
|
Joel researched the average daily temperature in his town. Average Daily
Temperature in Lloydminster, SK Month | Jan. | Feb. | Mar. | Apr. | May | Jun. | Jul. | Aug. | Sep. | Oct. | Nov. | Dec. | average daily temperature (°C) | –10.0 | –17.5 | –5.0 | 3.7 | 10.7 | 14.3 | 20.1 | 14.0 | 9.8 | 4.8 | –5.8 | –14.8 | | | | | | | | | | | | | |
Determine the mean of the
data to the nearest tenth of a degree.
|
|
|
22.
|
Environment Canada compiled data on the number of lightning strikes per square
kilometre in Saskatchewan and Manitoba towns from 1999 to 2008.
2.03
1.31 0.25
1.03 1.20
0.17
0.99 1.01
0.24 0.94
0.92 0.09
0.86
0.71 0.05
0.81 0.63
0.01
0.80 0.58
0.00 0.72
0.49 0.52
0.43
0.46 0.40
If the interval width is 0.5 and starts at 0.00, which
range of data has no entries?
|
|
|
23.
|
Four groups of students recorded their pulse rates after a 2 km run. | Group
1 | 126 | 168 | 158 | 192 | 146 | 166 | 104 | 164 | 116 | 138 | 172 | 136 | 152 | 128 | | Group 2 | 158 | 132 | 156 | 160 | 108 | 150 | 178 | 136 | 172 | 140 | 126 | 154 | 130 | 160 | | Group 3 | 136 | 174 | 156 | 176 | 150 | 166 | 142 | 156 | 130 | 182 | 180 | 166 | 148 | 172 | | Group 4 | 144 | 150 | 142 | 152 | 174 | 176 | 118 | 152 | 178 | 164 | 128 | 158 | 158 | 166 | | | | | | | | | | | | | | | |
Determine the mean of Group 1, to one decimal place.
|
|
|
24.
|
A poll was conducted about an upcoming election. The result that 65% of people
intend to vote for one of the candidates is considered accurate within ±4.2 percent points, 9
times out of 10.
State the confidence interval.
|
|
|
25.
|
Is the point (0, 0) in the solution set for the following system of linear
inequalities? {7 y – 2 x  5, y
> 3 x – 5, x  I, y  I}
|
Problem
|
|
|
26.
|
The manager of a customer support line currently has 250 unionized employees.
Their contract states that the mean number of calls that an employee should handle per day is 45,
with a maximum standard deviation of 7 calls. The manager tracked the number of calls that each
employee handles. Does the manager need to hire more employees if the calls continue in this
pattern? Daily Calls | Frequency | 26–30 | 3 | 31–35 | 15 | 36–40 | 44 | 41–45 | 76 | 46–50 | 63 | 51–55 | 39 | 56–60 | 8 | 61–65 | 2 | | |
|
|
|
27.
|
For every quilt that is sold at a fundraising banquet, $90 goes to charity. For
every ticket that is sold, $65 goes to charity. The organizers’ goal is to raise at least
$7000. The organizers need to know how many quilts and tickets must be sold to meet their
goal.
a) Define the variables and write a linear inequality to represent the
situation.
b) Graph the linear inequality to help you determine whether each of the
following points is in the solution set. The first coordinate is the number of quilts and the second
is the number of tickets.
i) (40, 50) ii) (10,
100) iii) (20, 75)
|
|
|
28.
|
A banner is being created for a soccer team.
• The length must be less
than 250 cm.
• The perimeter must be 600 cm or less.
Use a graph to choose three possible
combinations of length and width. Explain your choices.
|
|
|
29.
|
A student council is ordering signs for the autumn dance. Signs can be made in
letter size or poster size.
• No more than 50 of each size are wanted.
• They need
at least 20 poster size signs.
• No more than 75 signs are needed altogether.
•
Letter-size signs cost $6.50 each, and poster-size signs cost $10.95 each.
The student council
wants to minimize the cost of printing.
a) Create a model to represent this
situation.
b) Suppose that there is an additional $15 fee to set up the printers. How would
your model change?
|
|
|
30.
|
A refinery produces oil and gas. • At least 1.5 L of gasoline are
produced for each litre of heating oil. • The refinery can produce up to 8.5 million litres
of heating oil and 4 million litres of gasoline each day. • Gasoline is projected to sell
for $1.05 per litre. Heating oil is projected to sell for $1.90 per litre. The company needs to
determine the daily combination of gas and heating oil that must be produced to maximize revenue.
Create a model to determine this combination. What would the revenue be? Optimization
Model
Let g represent the number of millions of litres of gasoline. Let h
represent the number of millions of litres of heating oil. Let R represent the total
revenue from sales in millions of dollars. Restrictions: g Î R, h Î R Constraints: g
 0 h 
0 g  1.5 hg  4 h  8.5 Objective function to
maximize: R = 1.05 g + 1.90 h
|