Multiple Choice
Identify the
choice that best completes the statement or answers the question.
|
|
|
1.
|
For which inequality is (0, 9) a possible solution?
a. | y > 9 | b. | y < x
– 2 | c. | y  9
– 2x 9
– 2x | d. | y – 2x  10 10 |
|
|
|
2.
|
For which inequality is (–5, 1) a possible solution?
a. | y > 9 | b. | y – 2x  10
10 | c. | y  –9 + 2x –9 + 2x | d. | y <
x – 2 |
|
|
|
3.
|
For which inequality is (–50, –50) a possible solution?
a. | y  –9 + 2x –9 + 2x | b. | y
– 2x  10 10 | c. | y < x
– 2 | d. | y > 9 |
|
|
|
4.
|
What is the boundary line for the linear inequality y – 2 x
 10? a. | y = –2x – 10 | b. | y = 2x
+ 10 | c. | y = 2x – 10 | d. | y = –2x
+ 10 |
|
|
|
5.
|
Which test point is in the solution set for the linear inequality
{( x, y) | 5 x – 2 y  10, x  R, y  R}? a. | (5, 2) | b. | (2, 5) | c. | (1,
0) | d. | (0, 1) |
|
|
|
6.
|
Which test point is in the solution set for the linear inequality
{( x, y) | 7 x + 5 y  0, x  I, y  I}? a. | (2, 2) | b. | (–1, –1) | c. | (1,
1) | d. | (2, –2) |
|
|
|
7.
|
How would you graph the solution set for the linear inequality 4y
– 2x < 20?
a. | Draw a dashed boundary line y =  x + 10, then shade
above the line. x + 10, then shade
above the line. | b. | Draw a dashed boundary line y =  x + 10, then shade
below the line. x + 10, then shade
below the line. | c. | Draw a solid boundary line y =  x + 10, then shade below the
line. x + 10, then shade below the
line. | d. | Draw a solid boundary line y =  x + 10, then shade above the
line. x + 10, then shade above the
line. |
|
|
|
8.
|
What system of linear inequalities is shown here? 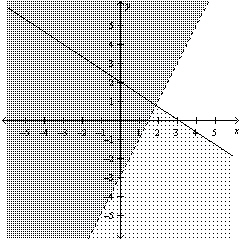 a. | 2x + 3y £ 6
y >
2x – 3 | b. | 2x + 3y < 6
y
> 2x – 3 | c. | 2x + 3y < 6
y
 2x – 3 2x – 3 | d. | 2x + 3y ? 6
y  2x – 3
 |
|
|
|
9.
|
Describe the boundary lines for the following system of linear
inequalities. { y  2 + x, x + y
 0, x  R,
y  R} a. | Dashed line along y = x + 2; dashed line along y =
–x | b. | Dashed line along y = x + 2; solid line along y =
–x | c. | Solid line along y = x + 2; dashed line along y =
–x | d. | Solid line along y = x + 2; solid line along y =
–x |
|
|
|
10.
|
Which test point is in the solution set for the following system of linear
inequalities? {10 y – 5 x  0, 4 x +
2 y > 10, x  I, y  I} a. | (2, 1) | b. | (3, 0) | c. | (1,
2) | d. | (0, 0) |
|
|
|
11.
|
What system of linear inequalities is shown here? 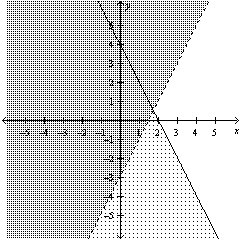 a. | 2x + y  4 4
y <
2x – 3 | b. | 2x + y  4 4
y > 2x
– 3 | c. | 2x + y  4 4
y >
2x – 3 | d. | 2x + y  4 4
y < 2x
– 3 |
|
|
|
12.
|
A vending machine sells juice and pop.
• The machine holds, at most,
200 cans of drinks.
• Sales from the vending machine show that at least 3 cans of juice are
sold for each can of pop.
• Each can of juice sells for $1.50, and each can of pop sells for
$1.00.
Let x represent the number of cans of pop.
Let y represent the number of
cans of juice.
How would you write the objective function for revenue, R?
a. | R = x + 1.50y | b. | R = 1.25x +
y | c. | R = 1.50(x + y) | d. | R = 1.50y –
x |
|
|
|
13.
|
Jan volunteers to fold origami frogs and swans for a display.
• She
has 8 squares of green paper for the frogs and 12 squares of white paper for the swans.
• It
takes her 4 min to fold an origami frog and 3 min to fold an origami swan.
• There
must be two swans for every frog.
Let f represent the number of frogs.
Let s
represent the number of swans.
Which of the following points is in the feasible
region?
a. | (1, 1) | b. | (1, 20) | c. | (5,
10) | d. | (10, 10) |
|
|
|
14.
|
Which location best describes where would you find the optimal solutions to an
objective function?
a. | outside the feasible region | b. | at or near the points of
intersection | c. | within the feasible region | d. | along a boundary
line |
|
|
|
15.
|
The following model represents an optimization problem. Determine the maximum
solution. Restrictions: x  R y  R Constraints: x  4 x – y  12 x + 3 y  24 Objective function: G = x – 2 y
a. | (4, –2) | b. | (8, –2) | c. | (4,
–8) | d. | (12, 0) |
|
Short Answer
|
|
|
16.
|
Graph the solution set for the linear inequality 5 y – 2 x
 15.
|
|
|
17.
|
The following model represents an optimization problem. Determine the maximum
solution. Restrictions: x  R y  R Constraints: x  0 y 
0 2 x + y  10 x + y  20 Objective function: Q = 2 y – 10 x
|
|
|
18.
|
A butcher shop makes hamburger patties and sausages. Hamburger patties sell for
$2.50 and sausage sell for $2. The butcher noticed that they always sell at least four times as many
hamburger patties as sausages. The butcher never sells more than 1000 hamburger patties.
Let
h represent the number of hamburger patties sold.
Let s represent the number of
sausages sold.
Write a system of linear inequalities to describe the constraints. Then, write an
objective function that represents the profit made from the sale of hamburger patties and
sausages.
|
Problem
|
|
|
19.
|
For every quilt that is sold at a fundraising banquet, $90 goes to charity. For
every ticket that is sold, $65 goes to charity. The organizers’ goal is to raise at least
$7000. The organizers need to know how many quilts and tickets must be sold to meet their
goal.
a) Define the variables and write a linear inequality to represent the
situation.
b) Graph the linear inequality to help you determine whether each of the
following points is in the solution set. The first coordinate is the number of quilts and the second
is the number of tickets.
i) (40, 50) ii) (10,
100) iii) (20, 75)
|
|
|
20.
|
The staff in a cafeteria are making two kinds of sandwiches: salami and
cheese.
• A maximum of 820 sandwiches are needed.
• Based on previous demand, there
should be at least two cheese sandwiches for every three salami sandwiches.
a) Define the
variables and write a system of inequalities that models this situation.
b) Suggest two
combinations of numbers of sandwiches that the cafeteria staff could make.
|
|
|
21.
|
Andrew has two summer jobs.
• He works no more than a total of 25 h a
week. Both jobs allow him to have flexible hours but in whole hours only.
• At one job,
Andrew works no less than 12 h and earns $9.00/h.
• At the other job, Andrew works no more
than 20 h and earns $8.25/h.
What combination of numbers of hours will allow him to maximize his
earnings? What can he expect to earn?
|