Multiple Choice
Identify the
choice that best completes the statement or answers the question.
|
|
|
1.
|
Which graph represents the solution to the inequality 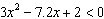 ?
|
|
|
2.
|
Which graph represents the solution to the inequality  ?
|
|
|
3.
|
The solution set to the inequality 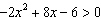 is
|
|
|
4.
|
The solution set to the inequality  is
|
|
|
800 people will attend a concert if tickets cost $20 each. Attendance will
decrease by 30 people for each $1 increase in the price. The concert promoters need to make a minimum
of $12 800.
|
|
|
5.
|
What quadratic inequality represents this situation?
|
|
|
6.
|
Which graph represents the solution to the inequality 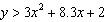 ?
|
|
|
7.
|
Which graph represents the solution to the inequality 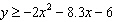 ?
|
|
|
8.
|
The solution to the inequality  is
|
|
|
9.
|
Which point does not satisfy the inequality  ? 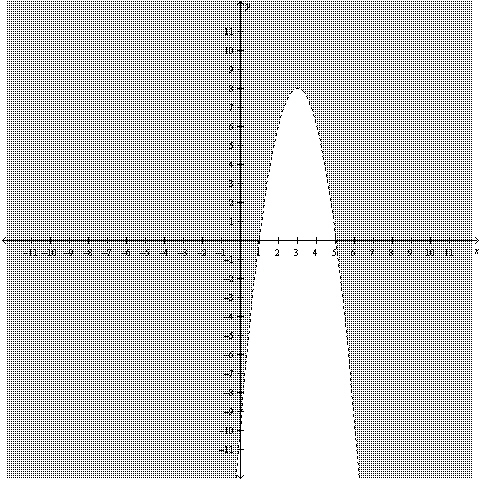
|
|
|
A rock is thrown upward with an initial velocity of 14 m/s. The motion of the
rock can be modelled by the equation 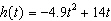 . .
|
|
|
10.
|
To the nearest hundredth of a second, for what period of time is the
rock’s altitude greater than 6 m?
|
Short Answer
|
|
|
1.
|
Given the quadratic inequality  : a) Graph the
inequality. b) Solve the inequality. 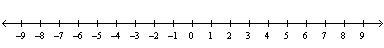
|
|
|
2.
|
What is the solution for  ?
|
|
|
3.
|
Graph the inequality  and state the solution set.
|
|
|
4.
|
Graph the quadratic inequality  . 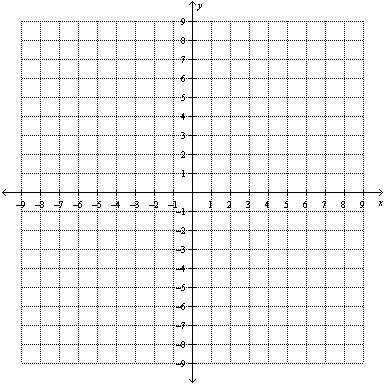
|
|
|
5.
|
a) Sketch the graph of the quadratic inequality 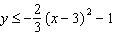 . b)
Check your answer using a test point not in the solution region you graphed.. 
|