Multiple Choice
Identify the
choice that best completes the statement or answers the question.
|
|
|
1.
|
The graph of  is
|
|
|
2.
|
The graph of  is
|
|
|
3.
|
Which inequality represents the graph shown below? 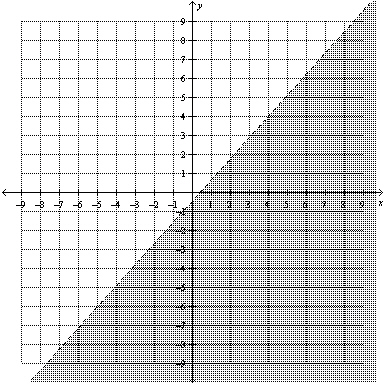
|
|
|
4.
|
The graphical solution to y <  x x  is
|
|
|
5.
|
Which inequality represents the graph shown below? 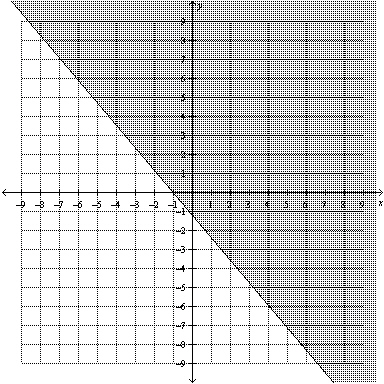
|
|
|
A sports store makes a profit of $50 on every pair of cross-country skis sold
and $125 on every set of snowshoes sold. The manager’s goal is to have a profit of at least
$700 a day from the sales of these two items.
|
|
|
6.
|
If x represents the number of pairs of cross-country skis sold and
y represents the number of pairs of snowshoes sold, what inequality models the combinations of
ski and snowshoe sales that will meet or exceed the daily profit goal?
|
|
|
7.
|
Which graph represents the combinations of ski and snowshoe sales that will meet
or exceed this daily sales goal?
|
|
|
A banquet room can seat up to 600 guests. Each rectangular table seats 11
guests and each circular table seats 6 guests.
|
|
|
8.
|
If r represents the number of rectangular tables and c represents
the number of circular tables, which graph represents the possible combinations of rectangular and
circular tables?
|
|
|
9.
|
If the banquet organizers want to have close to the same number of rectangular
and circular tables, what combination of tables could they use and still seat the maximum number of
people?
A | 24 rectangular and 24 circular tables | C | 37 rectangular and 37 circular
tables | B | 35 rectangular and 35 circular tables | D | 9 rectangular and 9 circular
tables |
|
Short Answer
|
|
|
1.
|
Which of the given ordered pairs belong to the solution to the inequality  ?
Use a graph of the inequality to show your reasoning in each case. 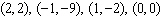  .
|
|
|
2.
|
Graph the inequality  . 
|
|
|
3.
|
Graph the inequality  . 
|
Problem
|
|
|
1.
|
Two real numbers, m and n, are related by the inequality  . a) Graph the inequality.  b) b) List three ordered pairs in
the form  that satisfy the inequality.
|
|
|
2.
|
The length of a rectangle, l metres, is greater than or equal to 1 m less
than twice the width, w metres. a) Write an inequality to describe the
situation. b) What are the restrictions on the length and width? c) Graph
l versus w for the inequality. d) List three possible sets of dimensions for
the rectangle. 
|
|
|
3.
|
Rosa’s professor says that the midterm exam will count for 40% of each
student’s grade and the final exam will count for 60%. A score of at least 90% is needed for an
A. a) Graph the inequality that represents this problem.  b) b) What are the
limitations on the variables in this problem?
|